Spectra viewer
Powerful viewer to explore our large fluorophore database
You can find our Spectra viewer here.
Over the past years we have collected a large number of fluorescent spectra for 1-, 2- and 3-photon excited fluorescence. Our database contains additional fluorophore information (e.g. extinction coefficients, quantum yield, lifetime) for most of the fluorophores and provides a number of ways to display, select and compare the properties of various fluorophores. We have built an online spectra viewer that also provides access to a large number of spectra of optical components, such as light sources, filters and mirrors. Here is a list of some of the features of our spectra viewer:
- The viewer uses a large database with more than 550 fluorophores and spectra of more than 250 optical elements (filters and mirrors).
- The database contains two-photon excitation spectra for more than 50 fluorophores and we are planning on adding additional spectra in the near future.
- Custom spectra can be uploaded and displayed along with the spectra contained in the database.
- Plots can be displayed using normalized or absolute values on a linear or logarithmic axis.
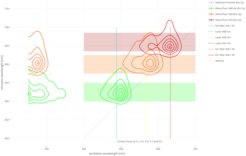
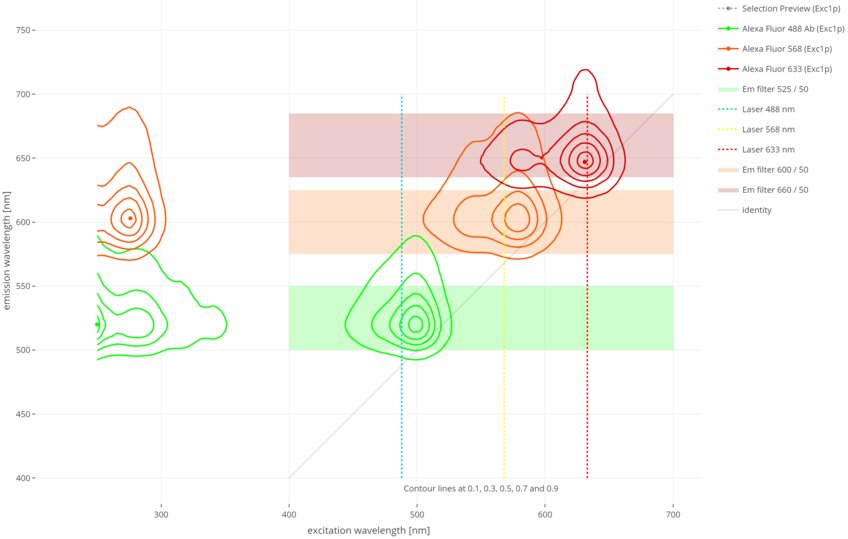
- In addition to the “standard” spectral plots the viewer interface contains a “2D viewer” in which excitation and emission spectra are combined into 2D contour plots. This is particularly useful when displaying excitation/emission spectra for various fluorophores simultaneously.
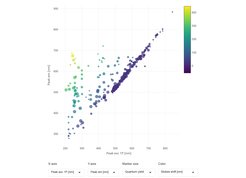
- A large number of additional fluorophore properties are contained in the database and can be accessed through a fluorophore browser (a table with various search and filter functions) or visualized using a 2D scatter plot. Up to four properties can be visualized simultaneously using the marker’s x- and y-coordinates as well as their size and color.

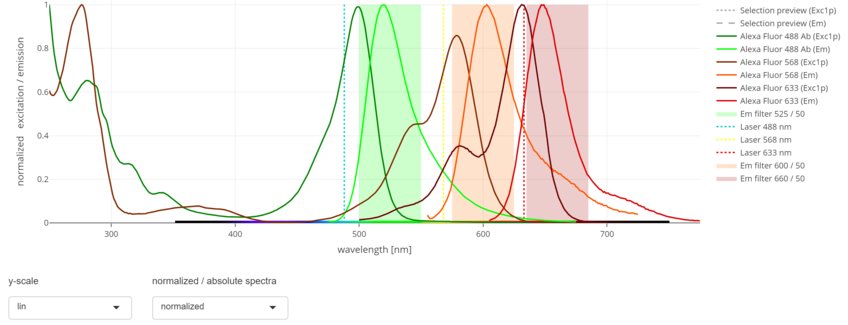
1D viewer: You can display spectra and custom elements (here: laser lines and emission windows) in the classical way

2D viewer: You can display the spectra as 2D-plots, by combining excitation and emission spectra in contour plots. Additional spectra (here: laser lines and emission windows) are superimposed on the 2D-plane. This view tends to be easier to read and interpret compared to the classical 1D-view, especially when using several fluorophores.

Scatter plot: You can compare fluorophores by using up to four parameters (x/y position, color, size)

Fluorophore browser: You can filter and search the database using fluorophore name or other properties


