Multimedia

Loomba et al. 2022

original

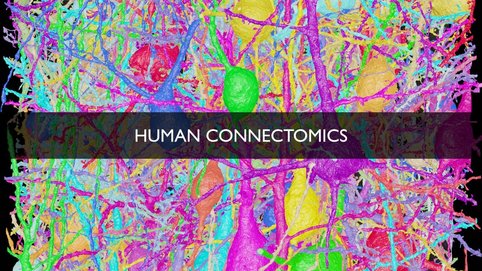
Connectomic screening across mammalian species: Comparison of five mouse, two macaque, and two human connectomic datasets from the cerebral cortex.
Automated reconstructions of all neurons with their cell bodies in the volume shown, using random colors. The analyzed connectomes comprised a total of ~1.6 million synapses. Arrows indicate evolutionary divergence: the last common ancestor between human and mouse, approximately 100 million years ago, and the last common ancestor between human and macaque, about 20 million years ago. 
Dense network mapping in human cortex reveals a large interneuron-to-interneuron network that is almost absent in the mouse. This novel neuronal network may constitute a key evolutionary invention in human cortex. Loomba et al., Science 2022 (science.org/doi/10.1126/science.abo0924)<br />&nbsp;

Dense network mapping in human cortex reveals a large interneuron-to-interneuron network that is almost absent in the mouse. This novel neuronal network may constitute a key evolutionary invention in human cortex. Loomba et al., Science 2022 (science.org/doi/10.1126/science.abo0924)
 
https://www.youtube.com/watch?v=5oZXnUrsgiY

For more information see here

Gour et al. 2021

original

Data from 7, 9, and 14 days of age are shown, with cell bodies, axons, and dendrites reconstructed. Under the datasets, matrices describing the neuronal connectivity (“connectomes”) are displayed. Synaptic preference for cell bodies, dendrites, and axon initial segments is a hallmark of circuit structure in the cerebral cortex, and this connectomic developmental screening study uncovers precise timelines of the synaptic preference development in the cortex.
How can you build neuronal networks that are more complex than anything known today? Researchers at the Max Planck Institute for Brain Research in Frankfurt, Germany, have mapped the development of inhibitory neuronal circuitry and report the discovery of distinct circuit formation principles. Their findings enable scientists to monitor the change of neuronal network structure longitudinally, capturing moments when an individual grows and adapts to its environment. Gour et al., Science 2020 (science.org/doi/10.1126/science.abb4534)<br />&nbsp;

How can you build neuronal networks that are more complex than anything known today? Researchers at the Max Planck Institute for Brain Research in Frankfurt, Germany, have mapped the development of inhibitory neuronal circuitry and report the discovery of distinct circuit formation principles. Their findings enable scientists to monitor the change of neuronal network structure longitudinally, capturing moments when an individual grows and adapts to its environment. Gour et al., Science 2020 (science.org/doi/10.1126/science.abb4534)
 
https://www.youtube.com/watch?v=tVdkPvDa1JM
Researchers use connectomic mapping in the developing cortex to uncover the developmental wiring rules for inhibitory neurons Gour et al., Science 2020 (science.org/doi/10.1126/science.abb4534)

Researchers use connectomic mapping in the developing cortex to uncover the developmental wiring rules for inhibitory neurons Gour et al., Science 2020 (science.org/doi/10.1126/science.abb4534)
https://www.youtube.com/watch?v=nc11Ppr6dh8

For more information see here

Karimi et al. 2020

original

Reconstruction of all ADs contained in the ACC dataset (blue-green, n = 61 layer 2 and n = 152 deep layer ADs, respectively) and a subset of axons innervating them (n = 62, yellow-orange). Note that 80–90% of all pyramidal cells in cortex extend their apical dendrites into the L1/2 border region, allowing for massive synaptic convergence (https://wklink.org/8300).  
 

For more information see here

Motta et al. 2019

original

Dense reconstruction of ~500,000 cubic micrometers of cortical tissue yielding 2.7 m of neuronal cables (~3% shown, front) implementing a connectome of ~400,000 synapses between 34,221 axons and 11,400 postsynaptic processes (fraction shown, back).
These data were used for connectomic cell-type definition, geometrical circuit analysis, and measurement of the possible plastic fraction (the “learnedness”) of the circuit. 
&nbsp;Analysis of neurons and their synapses in a dense reconstruction from the cerebral cortex. Science 2019 (science.org/doi/10.1126/science.aay3134). Mammalian brains, with their unmatched number of nerve cells and density of communication between them, are the most complex networks known. While methods to analyze neuronal networks sparsely, accessing about one in every ten thousandth nerve cell have been available for decades, the dense mapping of neuronal circuits by imaging each and every synapse and all neuronal wires in a given piece of brain tissue has been a major challenge. In an article published October 24, 2019 in Science, researchers from the Max Planck Institute for Brain Research in Frankfurt, Germany, report that they succeeded in the dense connectomic mapping of about half a million cubic micrometers of brain tissue from the mouse cerebral cortex using 3-dimensional electron microscopy and AI-based image analysis. Colorful version&nbsp;https://youtu.be/3dGTStDw3J4<br /><br />&nbsp;

 Analysis of neurons and their synapses in a dense reconstruction from the cerebral cortex. Science 2019 (science.org/doi/10.1126/science.aay3134). Mammalian brains, with their unmatched number of nerve cells and density of communication between them, are the most complex networks known. While methods to analyze neuronal networks sparsely, accessing about one in every ten thousandth nerve cell have been available for decades, the dense mapping of neuronal circuits by imaging each and every synapse and all neuronal wires in a given piece of brain tissue has been a major challenge. In an article published October 24, 2019 in Science, researchers from the Max Planck Institute for Brain Research in Frankfurt, Germany, report that they succeeded in the dense connectomic mapping of about half a million cubic micrometers of brain tissue from the mouse cerebral cortex using 3-dimensional electron microscopy and AI-based image analysis. Colorful version https://youtu.be/3dGTStDw3J4

 
https://www.youtube.com/watch?v=bpIKBkf5QRE

For more information see here

PLASS 2017

original

The dense neuronal network of the medial entorhinal cortex (neuronal cables in grey) and the surprisingly precise pattern of synapses found in this part of the brain shown in color. Schmidt et al. Nature 2017; © Max Planck Institute for Brain Research, Frankfurt/Main, Germany. Design: Julia Kuhl www.somedonkey.com
original

Nerve cell “trio” (in color) found to be very specifically connected within the dense network of the brain (shown in grey). Schmidt et al. Nature 2017; © Max Planck Institute for Brain Research, Frankfurt/Main, Germany. Design: Julia Kuhl www.somedonkey.com
original

Precise sorting of synapses (in blue and red) within the dense network of the medial entorhinal cortex, reconstructed using connectomic techniques. Schmidt et al. Nature 2017; © Max Planck Institute for Brain Research, Frankfurt/Main, Germany. Design: Julia Kuhl www.somedonkey.com

For more information see http://plass.brain.mpg.de/.

webKnossos 2017

original

Illustration of cells from the cerebral cortex reconstructed in flight mode. Illustrations. Boergens et al. Nature Methods 2017; © Max Planck Institute for Brain Research, Frankfurt/Main, Germany. Design: Julia Kuhl www.somedonkey.com
original

Illustration of cells from the cerebral cortex reconstructed in flight mode. Illustrations. Boergens et al. Nature Methods 2017; © Max Planck Institute for Brain Research, Frankfurt/Main, Germany. Design: Julia Kuhl www.somedonkey.com
original

Illustration of cells from the cerebral cortex reconstructed in flight mode. Illustrations. Boergens et al. Nature Methods 2017; © Max Planck Institute for Brain Research, Frankfurt/Main, Germany. Design: Julia Kuhl www.somedonkey.com
original

Illustration of cells from the cerebral cortex reconstructed in flight mode. Illustrations. Boergens et al. Nature Methods 2017; © Max Planck Institute for Brain Research, Frankfurt/Main, Germany. Design: Julia Kuhl www.somedonkey.com

For more information see https://webknossos.org/.

SynEM 2017

original

Staffler et al. eLife 2017; © Max Planck Institute for Brain Research, Frankfurt/Main, Germany
original

Staffler et al. eLife 2017; © Max Planck Institute for Brain Research, Frankfurt/Main, Germany
original

Staffler et al. eLife 2017; © Max Planck Institute for Brain Research, Frankfurt/Main, Germany

SegEM 2015

<p><span>Flight along an axon in mouse cerebral cortex, showing the “skeleton” of the nerve cell; followed by a display of SegEM-reconstructed nerve cells. Berning, Boergens, Helmstaedter 2015, © Max Planck Institute for Brain Research</span></p>

Flight along an axon in mouse cerebral cortex, showing the “skeleton” of the nerve cell; followed by a display of SegEM-reconstructed nerve cells. Berning, Boergens, Helmstaedter 2015, © Max Planck Institute for Brain Research

https://www.youtube.com/watch?v=e9gUhwhLSDk

For more information see the SegEM paper.

Neural circuit reconstruction using SegEM

<span>“Neural circuit reconstruction using SegEM”, Berning, Boergens, Helmstaedter 2015 © Max Planck Institute for Brain Research</span>

“Neural circuit reconstruction using SegEM”, Berning, Boergens, Helmstaedter 2015 © Max Planck Institute for Brain Research
https://www.youtube.com/watch?v=mFhBJTXjqhM

Retina Flight 2013

Volume reconstruction of 950 nerve cells in a block of mouse retina. Each color represents one neuron. Flight along the blood vessels (appearing as “tunnels” in the dense web of neuronal processes). When diving into the nerve cell tissue, a large fraction of the volume is densely filled with nerve cell fibers, the “cables” in the brain. Glia cells and nerve cells that had their cell bodies outside of the data block are not shown. Helmstaedter et al., 2013; © Max Planck Institute for Medical Research, Heidelberg, Germany

Retina connectome 2013

<span>Illustration of the process by which a three-dimensional electron-microscopic data set is turned into a cellular-resolution connectivity matrix (“connectome”). Helmstaedter et al., 2013; © Max Planck Institute for Medical Research, Heidelberg, Germany</span>

Illustration of the process by which a three-dimensional electron-microscopic data set is turned into a cellular-resolution connectivity matrix (“connectome”). Helmstaedter et al., 2013; © Max Planck Institute for Medical Research, Heidelberg, Germany
https://www.youtube.com/watch?v=x-KL5B80V2o
Go to Editor View